A treatment map…
• goes from patients’ presenting symptoms through a sequence of diagnostic choices to treatment, and sometimes on to more choices and additional treatment.
• organizes the text so you only read what you need to, to deal with a particular case.
• gives different answers for different patients.
• allows for merging of clinical and research data in an applied context.
• may, through its pictorial representation, reveal gaps in knowledge that could be addressed in the future.
The actual maps appear on the companion site to this one, www.TreatmentMaps.net.
Details of Map Construction
Treatment Maps organize psychotherapeutic information to match the process of treatment, as it is carried out with patients. The objective is to represent the steps that an expert would follow in working with a patient with the symptoms the map addresses.
A Treatment Map consists of a set of flow charts, their associated text, and the relationship between the two forms of information.
Each map covers a limited area of treatment and attempts to show the process from start to finish. Diagnosis and treatment are presented as an integrated sequence of interrelated steps. The diagnostic choice made at any step affects the treatment opportunities that follow. Each step in treatment leads to further opportunities for diagnostic observation and later treatment choice.
Each point on a flow chart is linked to a corresponding section of text that explains it in greater detail. You follow the flow chart, and when you need more information, you link to the associated section of text.
Because it involves a dynamic relationship between two kinds of data, a map contains both the generality and organization of flow charts and the completeness and specificity of text.
No treatment map is complete. They may never be complete. Whenever we change our representation of the process, we can become aware of new opportunities to improve the process.
Using a Treatment Map
Treatment maps can’t replace clinical experience of intuition. However, they can help make our work more efficient and effective, by reminding us of steps that we can take and suggesting an order to taking them.
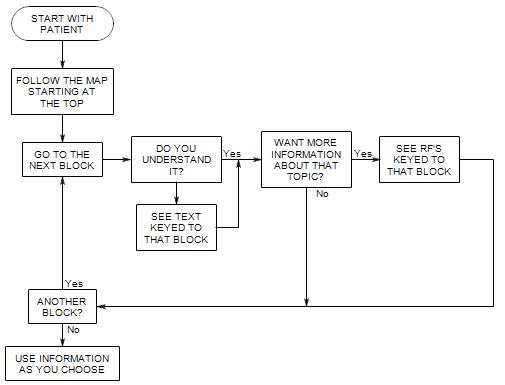
To use the maps, first go to the home page and select an area [alcohol misuse, anxiety , depression, etc.]. When you get there, start at the top of the first map with a particular patient in mind. Follow the arrows, and answer the questions for your patient in the order they appear. You will be directed to additional maps as needed, to continue the diagnostic and therapeutic process.
If at any point in the map you encounter a question or an instruction that you don’t understand, link to a corresponding section of text, for further information. Links are listed in the right-hand navigation bar for each map.
Additional references are cited in the sections of text associated with each box on the flow chart.
The process can be represented by a flow chart, as follows.